Find the pattern
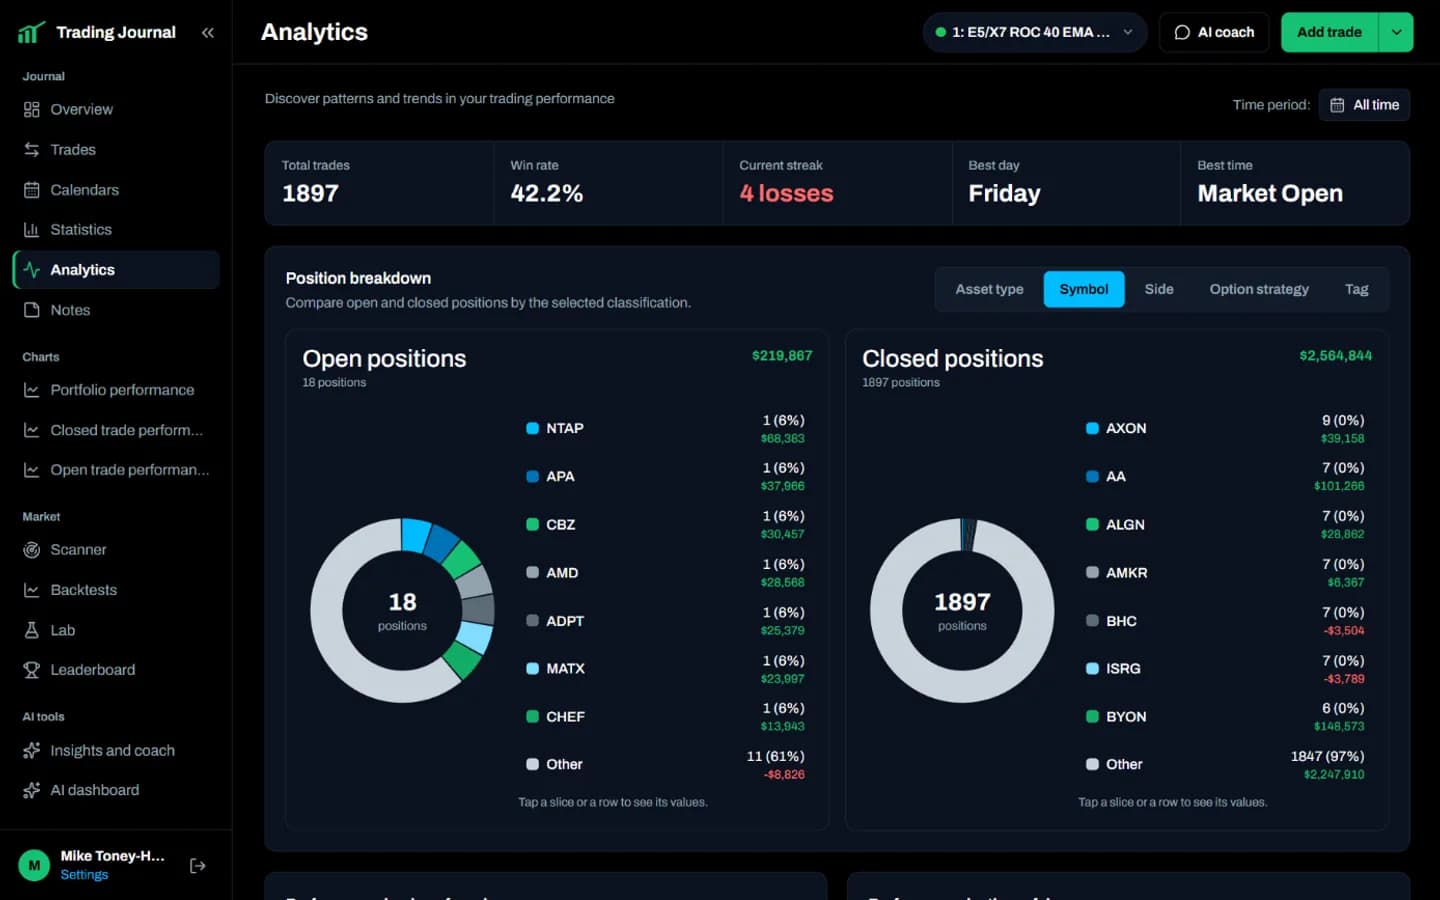
Break performance down by ticker, holding time, day, time of day, and more so your review points to a decision.
Financial Tech Wiz Trading Journal
Bring your trades and backtests from 25+ brokers, CSV files and spreadsheets into one place, with no manual entry, and instantly see your portfolio performance across every account. Swing traders also get a built-in breakout scanner with backtests of every scan, updated daily.
Then $19/month or $119/year. Secure checkout through Whop.
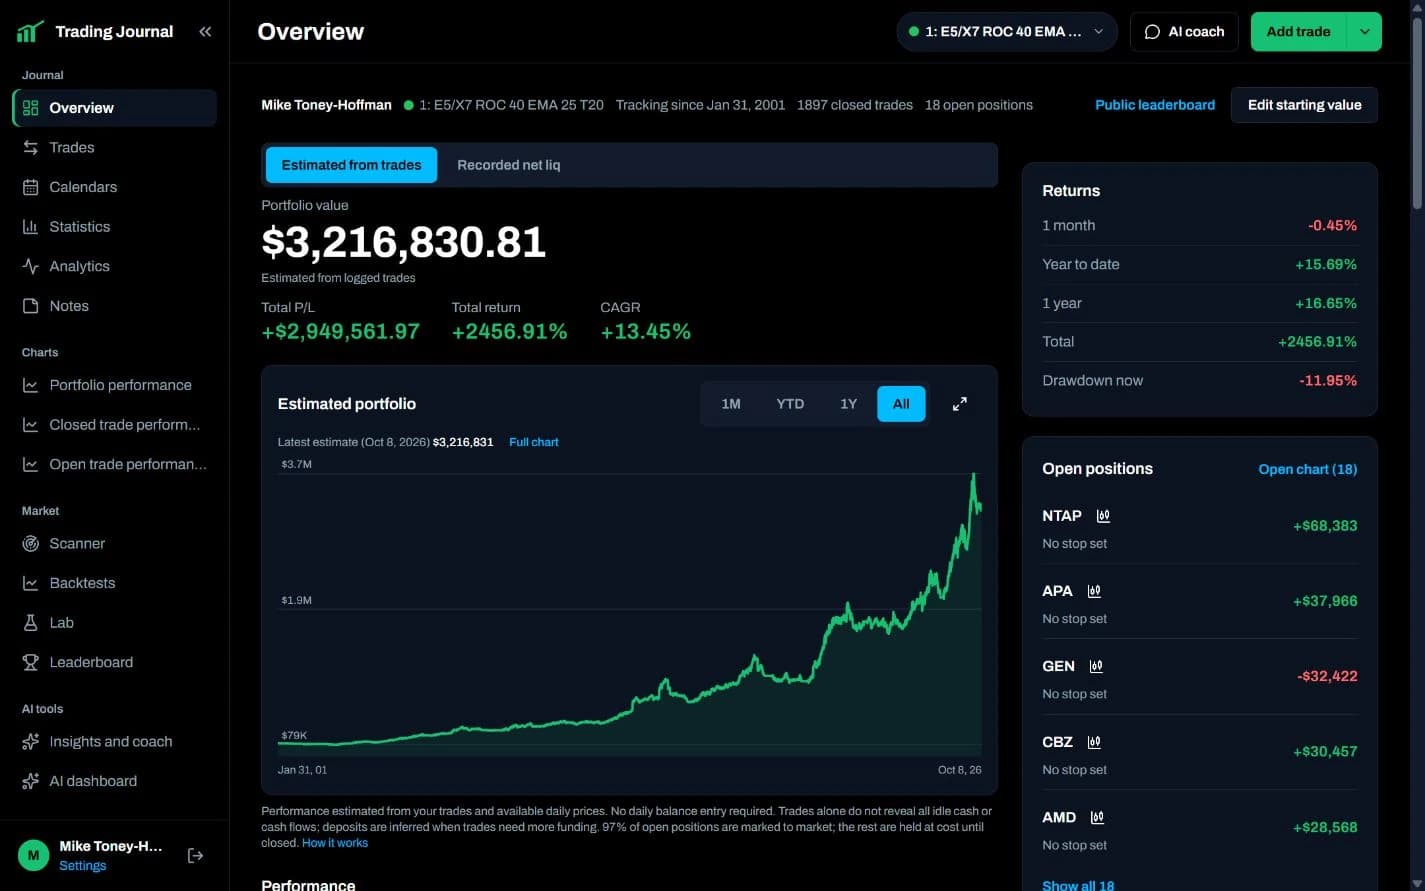
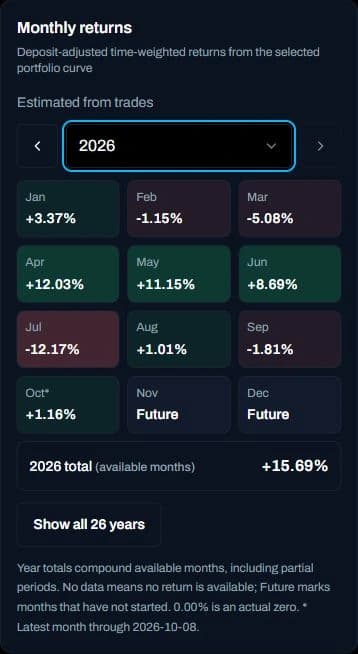
Example journal with imported historical trades. Hypothetical backtest results, not actual investment returns.
Trade charts
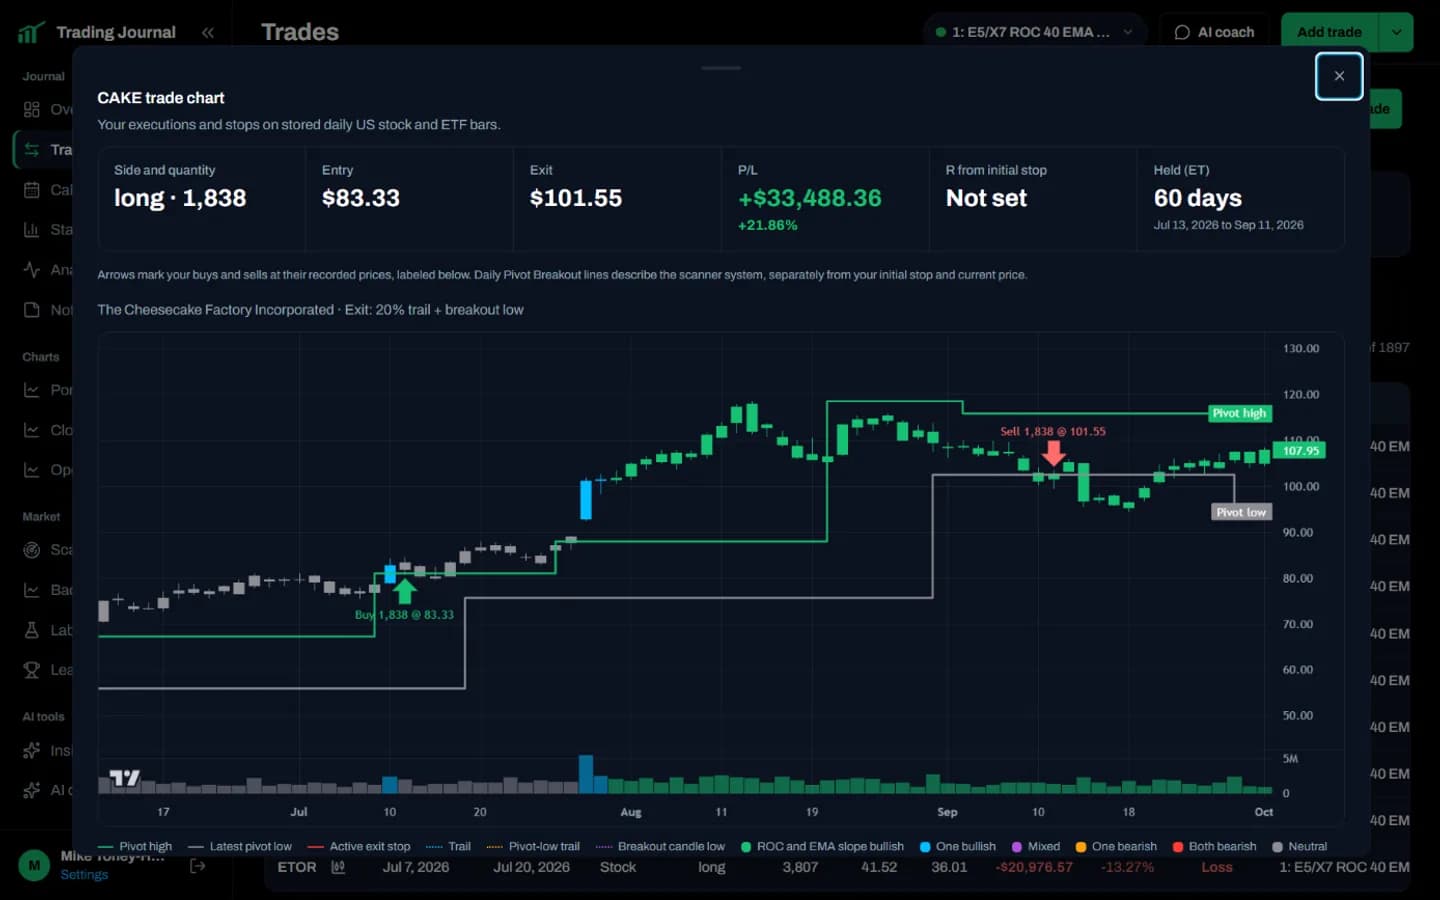
Open a supported US stock or ETF trade to review entry and exit markers on daily bars, plus your initial stop when set. Review what happened instead of trying to remember it.
Scanners and breakout history
The Daily Pivot Breakout Scanner checks every US stock and ETF and posts the day's breakouts shortly after the market closes. Every breakout comes with a chart, and you can look back at every breakout signal since 2000 to see how it played out.
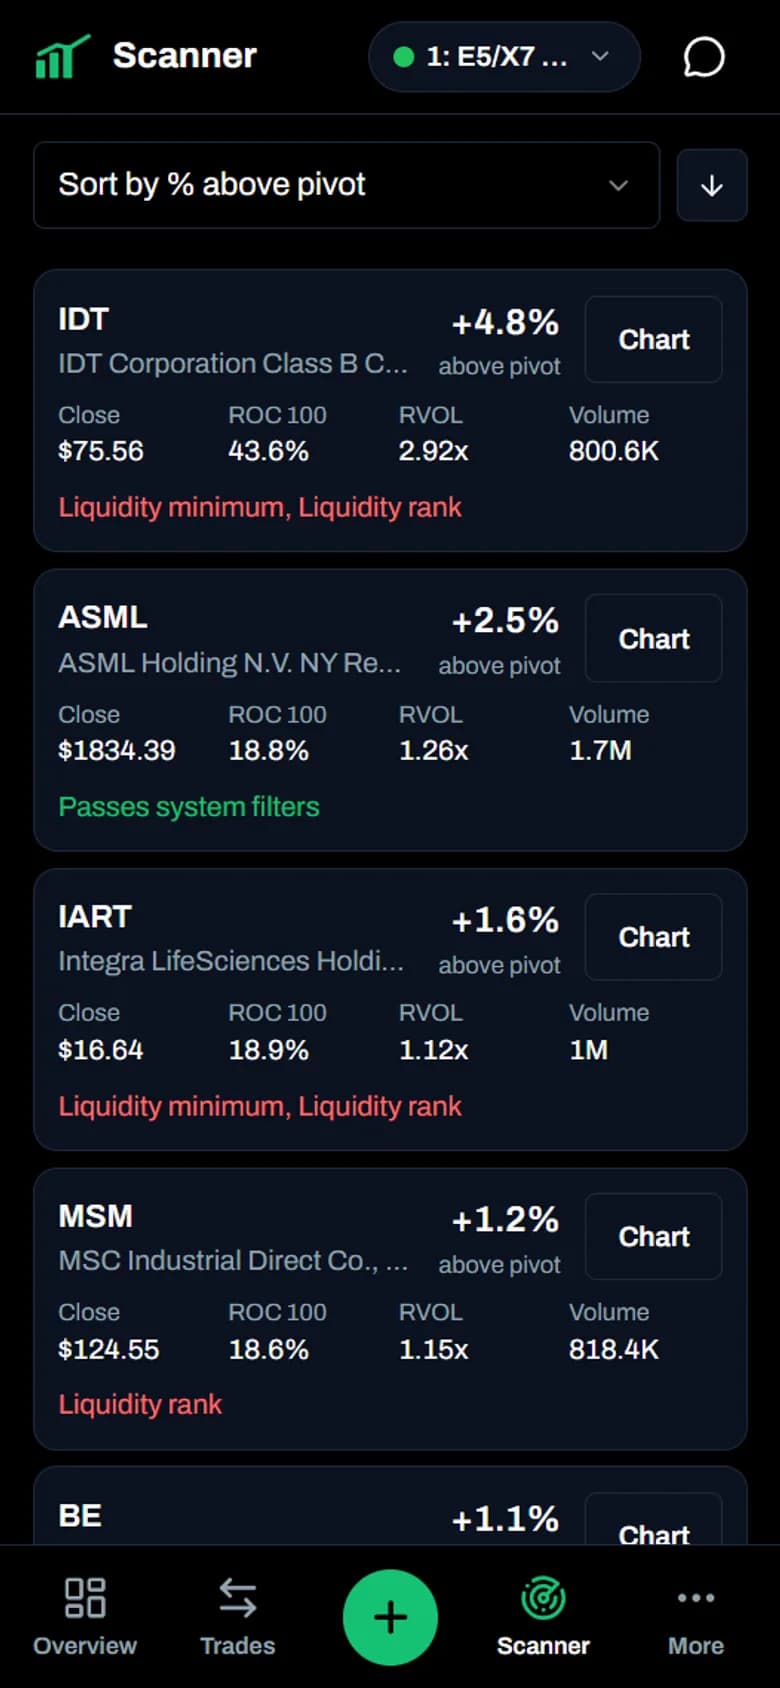
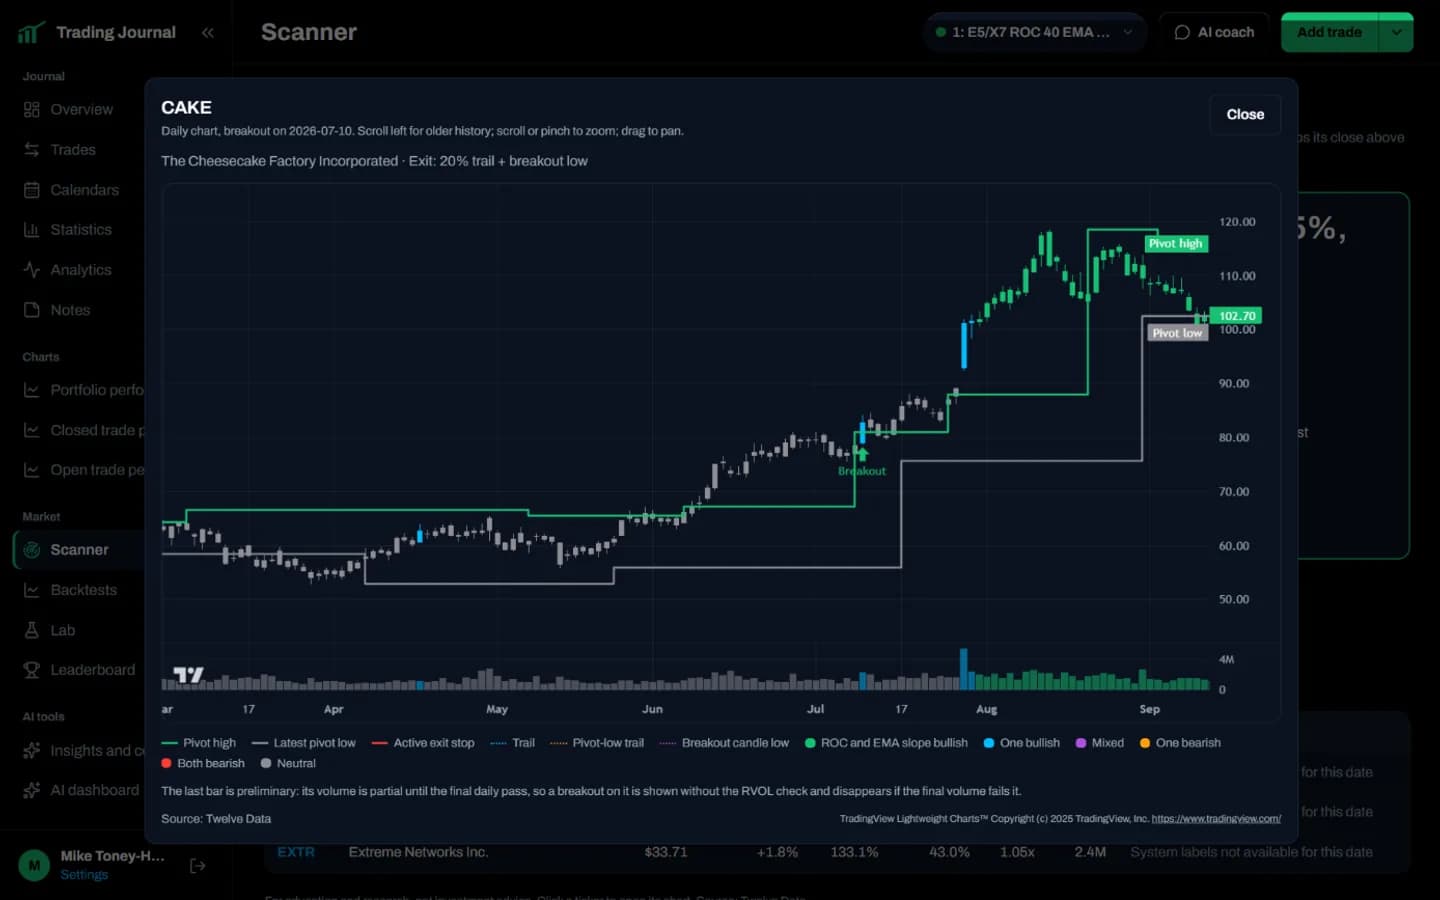
The strongest recent breakout from the free scanner, with the pivot line, breakout arrow and exit stops.
Results on historical data are hypothetical and do not guarantee future returns. More scanners are on the way: VCP, gap, Stage 2, cup and handle and more.
Review the why, not just the result
A journal is useful when it helps you make the next decision with more context than the last one.
Break performance down by ticker, holding time, day, time of day, and more so your review points to a decision.
Save notes, screenshots, categories, and the reasoning behind each entry so your history stays readable later.
Review drawdowns, open risk, and realized results alongside the market instead of relying on a single win-rate number.
Compare all of your portfolios and strategies to a benchmark
Import your trades and your portfolio performance builds itself, with no daily balance entry. Put your accounts, backtests and strategies on one chart against a benchmark like the S&P 500. Running three strategies? Keep each in its own journal and combine them in another to see the whole picture.
Chart your edge across different market environments
Choose a historical range or use pre-selected market-regime presets to compare the same portfolios and strategies through different market types, including a bull market, sideways market, crash, V-shaped recovery, grinding bear market, or prolonged bear market.
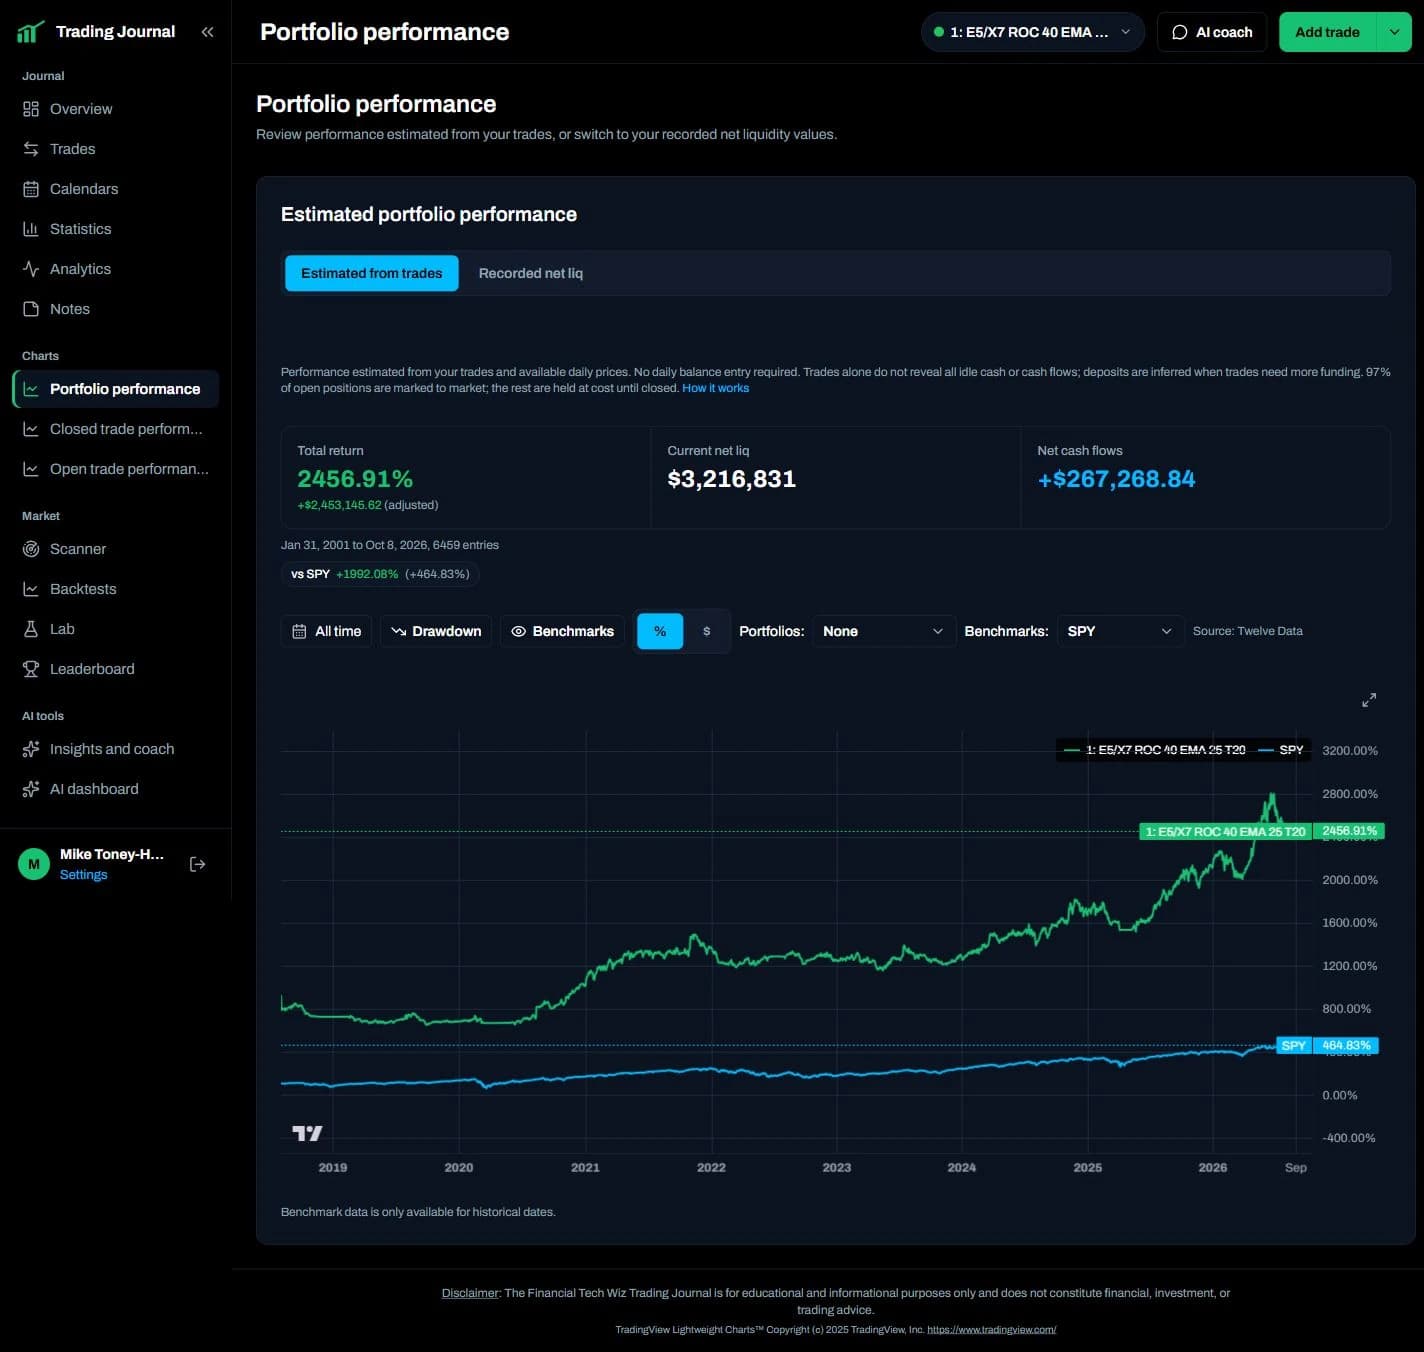
Example journal with imported historical trades. Hypothetical backtest results, not actual investment returns.
Built-in AI, or connect your own
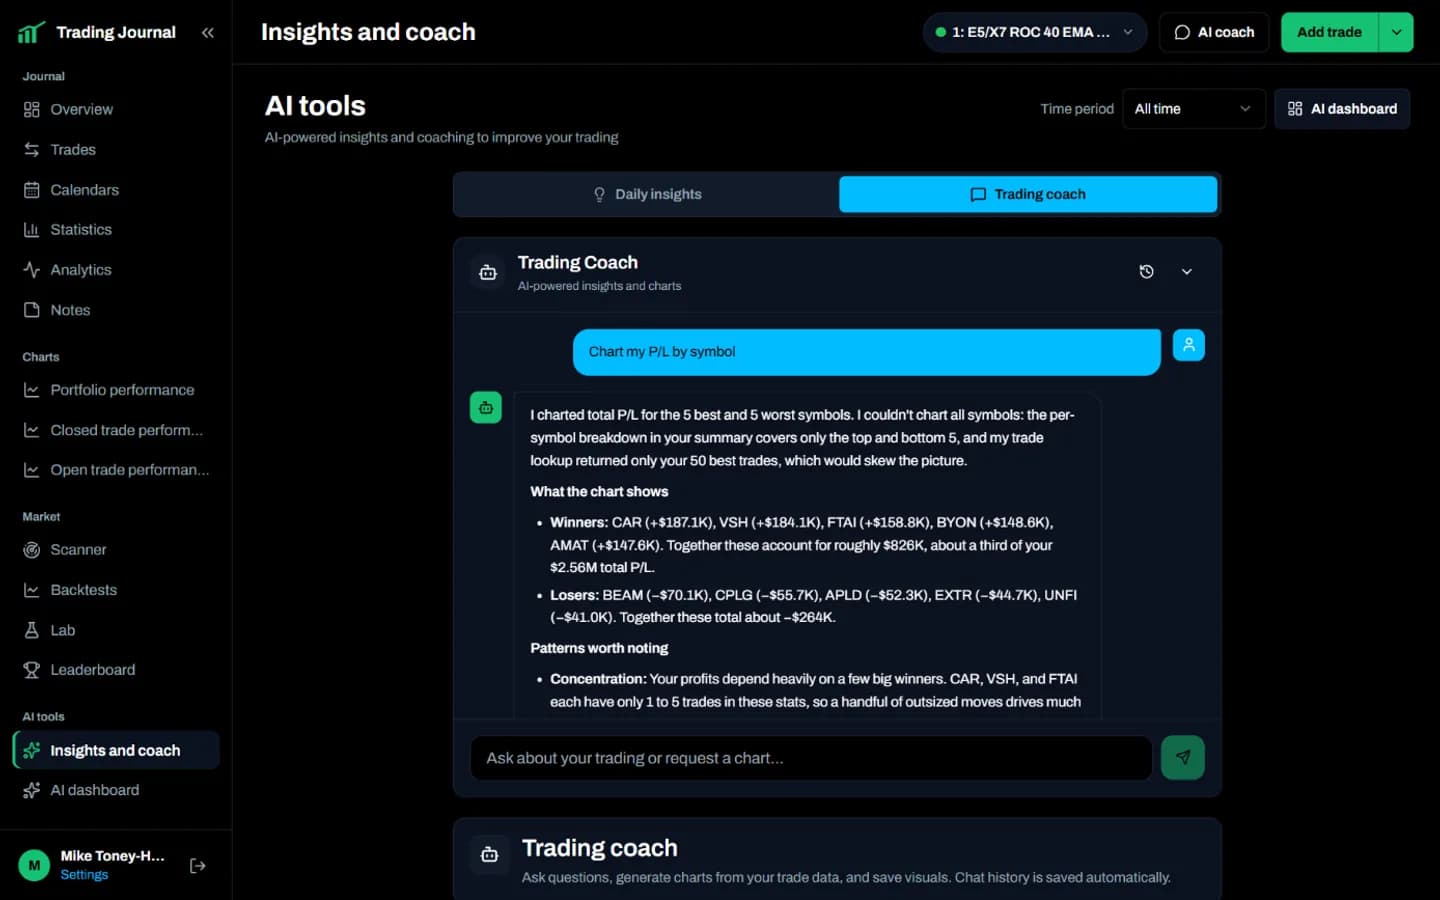
The built-in AI Trading Coach knows your trade history and the Daily Pivot Breakout history. Ask it to find the holes in your strategy, when a stock broke out, or how breakouts on that stock have played out since 2000. Or use the MCP server to connect your own agents and workflows to your journal and the breakout data through the API.
Analyze my top 10 worst trades, what I did wrong, and what I can do better.
When did NVDA break out, and how did those breakouts play out?
AI dashboard builder
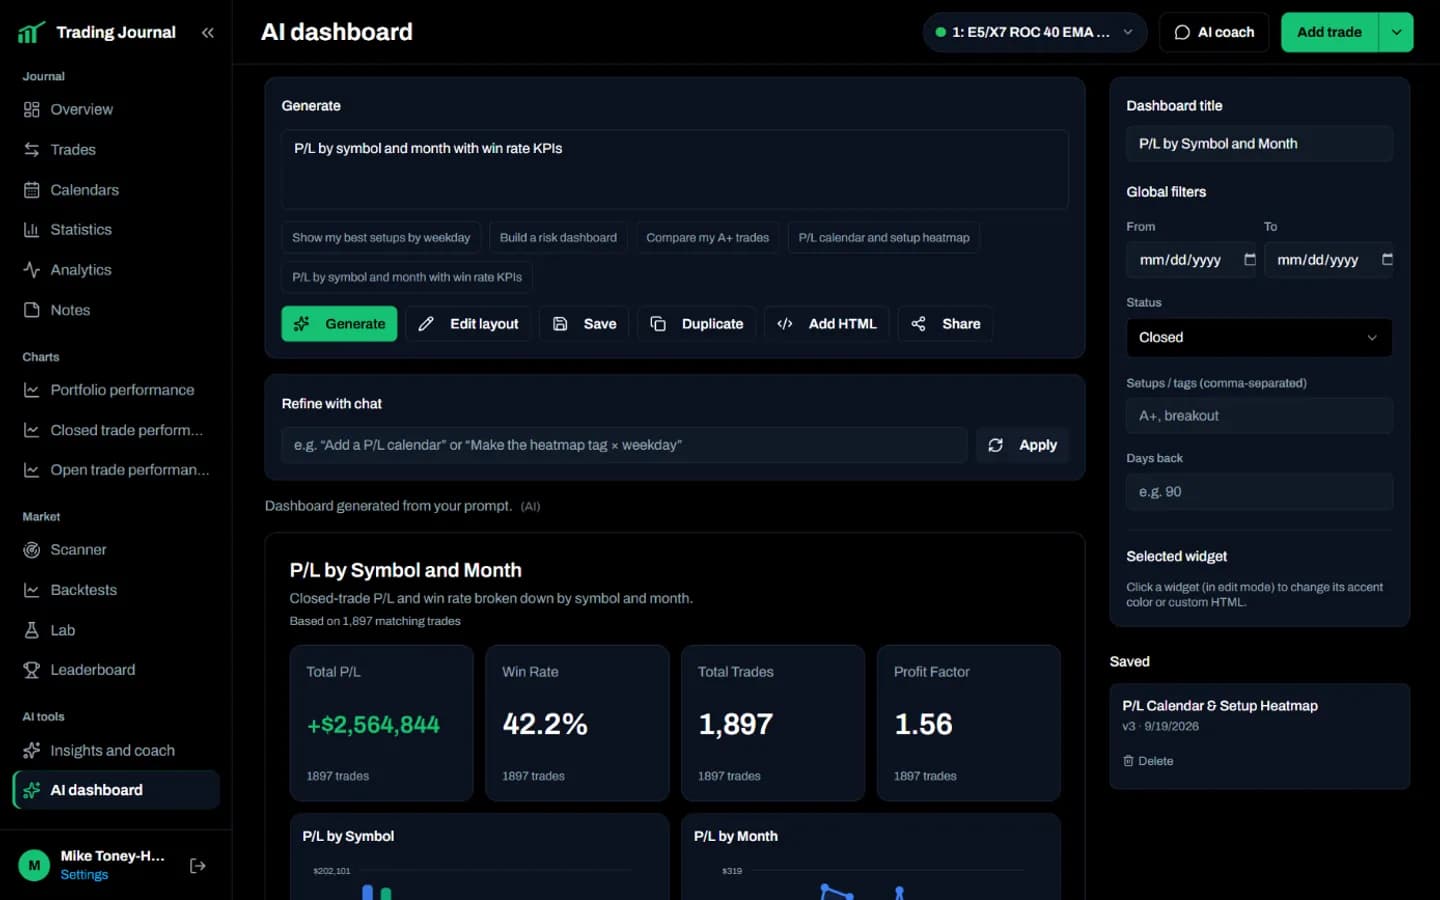
Type what you want to see, for example a risk dashboard or your best setups by weekday. The builder lays out KPIs, charts, tables, calendars and heatmaps from your journal. Drag, resize, save and share it.
A shorter path from logging to review
Start with importing your broker history or strategy data, add any additional notes for each trade, then use the journal to compare all of your live accounts, backtests, and strategies in one dashboard. Watch the full product tour to see how it all works before starting a trial.
Try the journal freeStart with the data you already have
Connect a supported broker or upload a CSV to import your trades. Send each broker account to its own journal, combine several into one, or both, and your portfolio performance is calculated for you with no manual entry. If you are moving from the Financial Tech Wiz Free Trading Journal Template, just download the Trade Log and Portfolio Net Liq Tracker as CSVs and import.
One subscription. Two ways to pay.
Try the Financial Tech Wiz Trading Journal free for seven days. Both plans include the journal, the Daily Pivot Breakout Scanner and its breakout history, performance comparisons and the premium community.
Annual
$9.92/month
Pay once for the year and get the same full access at a lower effective monthly cost.
$19/month on the monthly plan
Billed as $119/year after your 7-day free trial.
Save $109 a year compared with twelve monthly payments.
Monthly
$19/month
For traders who want full access without paying for a year up front.
Billed as $19/month after your 7-day free trial.
No annual commitment. Change plans through Whop.
Secure checkout and subscription management through Whop.
Questions, answered plainly
If you still need a detail that is not here, join the free Discord community and ask any question there.
No. Connect a supported broker, upload a file or log trades by hand, and the journal builds your portfolio performance from your trades and daily prices automatically. You can still record net liquidity values and switch to Manual Portfolio Performance.
Closely. The curve is built from your real executions and daily closing prices, and it uses your opening balance, deposits and withdrawals when you record them. Cash the journal cannot see, such as money that never traded, can change percentage returns, so record your starting balance for the closest match.
Both. Send each broker account to its own journal, combine any of them in another journal, or do both at once. For example, one journal for Robinhood, one for a Schwab Roth IRA, and one that combines them.
Positions without a daily price are held at cost until you log an exit, and an option with no logged exit counts as worthless at expiration. The performance view shows its pricing coverage and links to the calculation details. Available broker history varies by broker.
A trading journal, the Daily Pivot Breakout Scanner, the AI Trading Coach and premium Financial Tech Wiz Discord access in one membership: $19/month or $119/year, with a 7-day free trial.
Connect one of 25+ supported brokers and choose the dates to import, upload a CSV from your broker, bring over the Financial Tech Wiz Free Trading Journal Template, or add trades by hand or by asking the AI coach.
The journal connects with 25+ brokers, including Robinhood, Charles Schwab / thinkorswim, Interactive Brokers, Webull, tastytrade, Fidelity, E*Trade, TradeStation, Tradier, Kraken, Public, Coinbase, and more. View all supported brokers.
Entry and exit markers on daily bars for US stocks and ETFs, your initial stop and the trade's R when you set one, notes, tags and holding time, plus statistics and analytics across every trade.
The S&P 500 (SPY), Nasdaq 100 (QQQ), Russell 2000 (IWM) and gold (GLD). You can also put several of your journals on the same chart, or limit any chart to a date range or a market environment such as a bull market, a crash or a sideways market.
Every US stock and ETF that closes above its last confirmed pivot high with momentum and above-average volume, posted shortly after the market closes. You can step back through every scan since 2000 and open a chart for each breakout. A free, delayed sample is on the Financial Tech Wiz scanner page.
Yes. Every Daily Pivot Breakout signal since 2000 is listed with its chart and how it played out under the exit rules. Results on historical data are hypothetical and do not guarantee future results.
Ask it about the trades and patterns in your journal, or about the Daily Pivot Breakout history. Good places to start: Analyze my top 10 worst trades, what I did wrong, and what I can do better. or When did NVDA break out, and how did those breakouts play out? It can also draw charts from your trades and add trades or notes for you.
Describe the dashboard you want in plain English and it builds one from your trades with KPIs, charts, tables, calendars and heatmaps. Rearrange it, save versions and share it.
Yes. The MCP server connects Cursor, Claude or another MCP-compatible tool to your journal and to the Daily Pivot Breakout history. Import trades and backtests, review your trade history, ask when a stock broke out and how its breakouts played out, or automate journal updates. View the API and MCP docs.
Yes. The free scanner page shows the top 5 breakouts each week, 5 trading days late, with a chart for each. TrendSpider users can also add the Daily Pivot Breakout indicator to their charts for free from the custom trading tools page.
Yes. Log entry and exit times, review results by time of day and holding time, and use the same charts and statistics as swing trades.
$19/month, or $119/year (about $9.92 a month, 48% less than twelve monthly payments). Both start with a 7-day free trial. Checkout and your subscription are managed through Whop, where you can cancel anytime.